
Analysis Mode
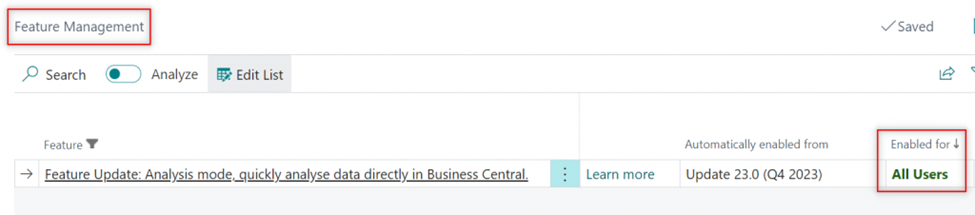
One of the largest updates to Microsoft’s user interfaces in recent years is just this functionality. It is among the top new features of this release due to what it is capable of. In the ‘Feature Management’ page, first, enable it.
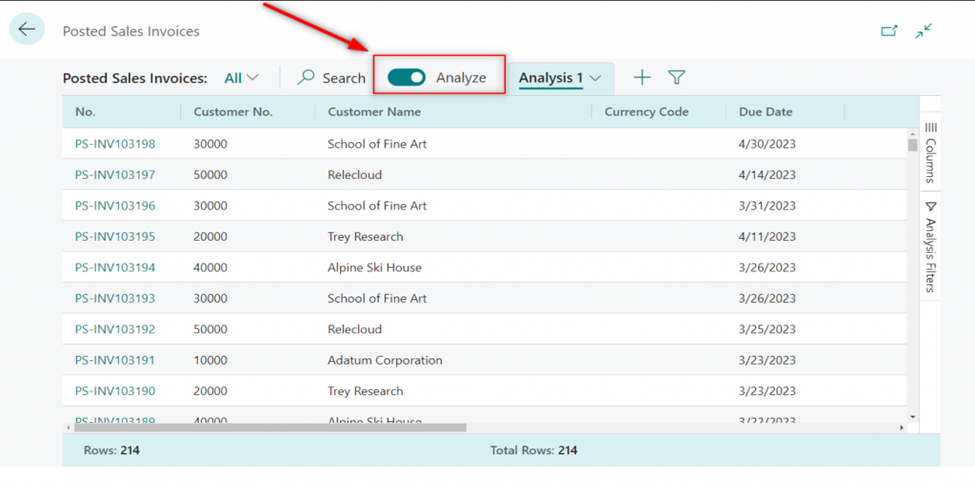
From this point forward, you can enable the “Analyze” switch on every list you view. You’ll see something similar when you do that.
Now, what can you do?
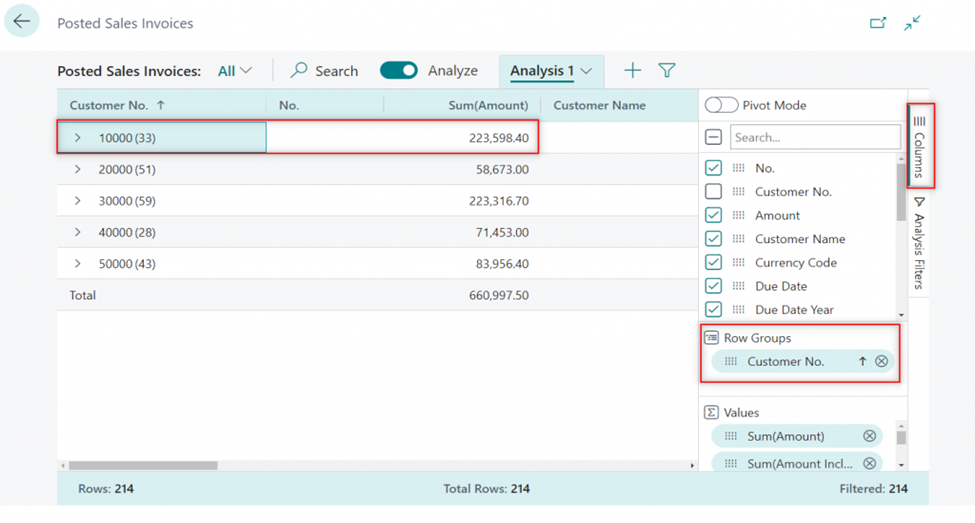
On the ‘Columns’ window, for instance, you can group by customer. A total of 33 invoices for customer ‘10000’ totaling 223,598.4 have been posted. Moreover, the total for each consumer is also shown.
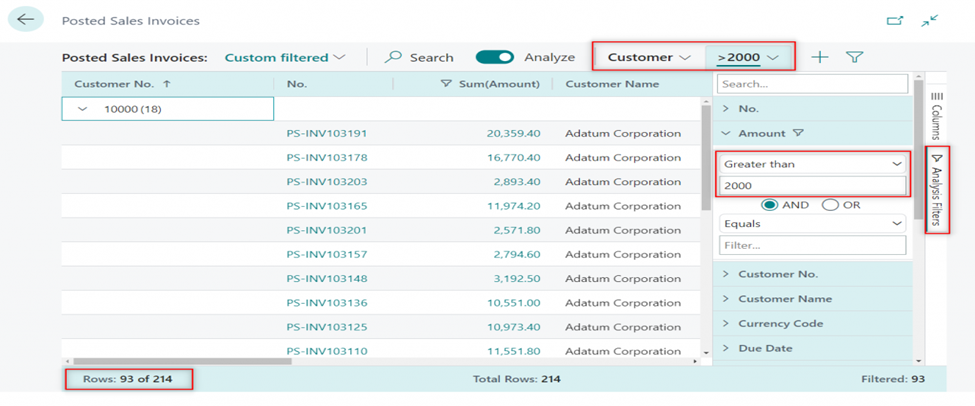
This analysis view can be saved, and new ones can be made. Under the “Analysis Filters” window, we are now filtering invoices that are more than 2000. Any invoice above can be expanded to be seen.
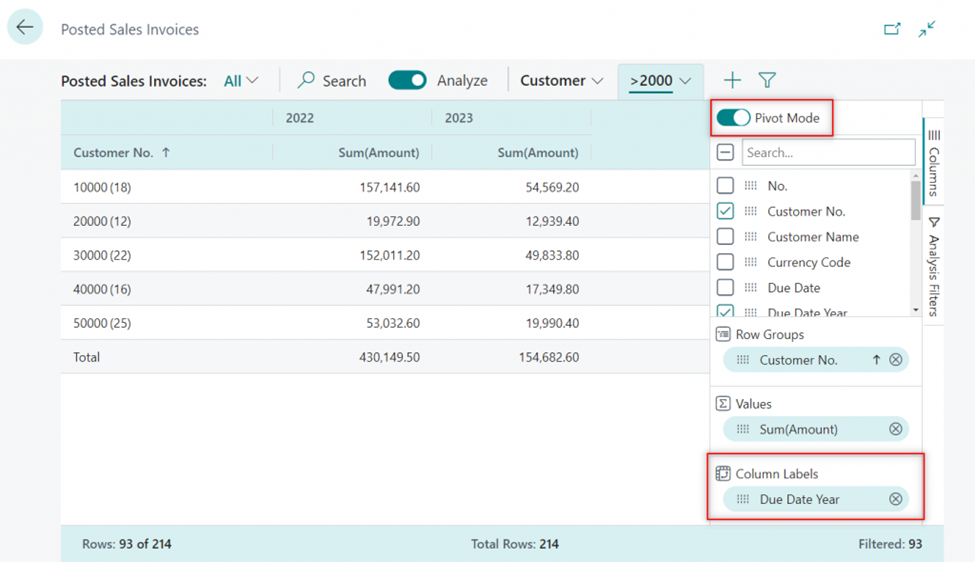
Moreover, you can activate “Pivot Mode” and make a view with columns for the due dates of uploaded bills, for instance.
With this new function, there are no restrictions; you can create a wide variety of perspectives and combinations. Don’t forget to give it a go!
Check out the following website for additional usage examples as well:
https://github.com/microsoft/BCTech/tree/master/samples/AnalyzeData
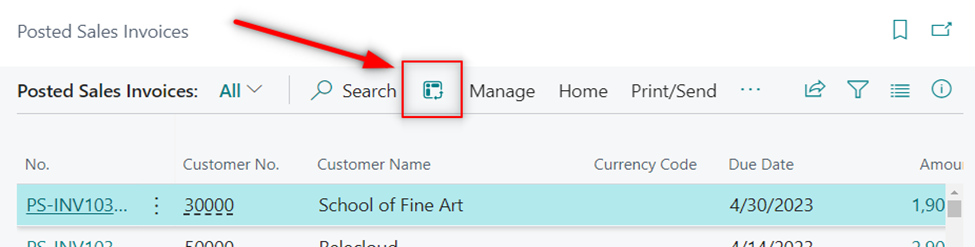
The switch gets transformed into this new logo when the screen is shrunk, as you can see.
Find the feature’s complete description here.